Maps of Exposed Population are displayed by selecting the tab "Exposed Pop."

Select a source fault using the "Seismic Source Fault" box and maps of Exposed Population appear.


You can select the reference year from the combobox on the sidebar.

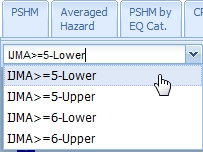
You can select a threshold of ground motion intensity (JMA seismic intensity) from the combobox on the toolbar.
The distribution of population exposed to the selected threshold or more appears.

You can select a distribution of population from daytime and nighttime population, which is base dataset of the map of Exposed Population, using radio buttons.
NOTE: Since quarter dividing of meshes, values of population may not consistent with values published by Ministry of Internal Affairs and Communications/local government.

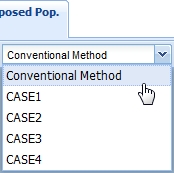
You can select a scenario of earthquake from several cases using the "Scenario" combobox on the toolbar.
"Conventional Method" shows the distribution based on expected JMA seismic intensity calculated on maps of CPE.
An individual case ("CASE N") is equal to Case No. used on calculation of SESM.
Note that it is available only if major active fault zone is selected.

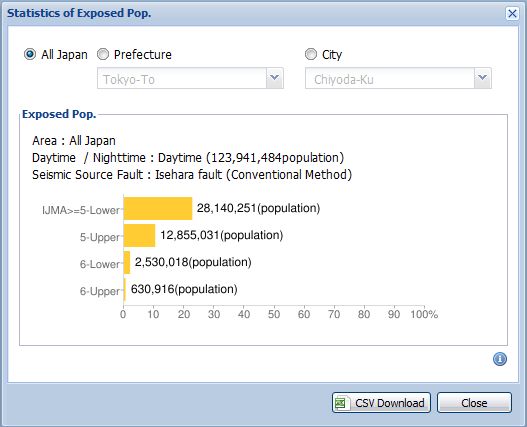
Click the "Stat" button on the toolbar to see statistics of exposed population.
The graph shows exposed population and its ratio to whole population for each threshold of JMA seismic intensity.

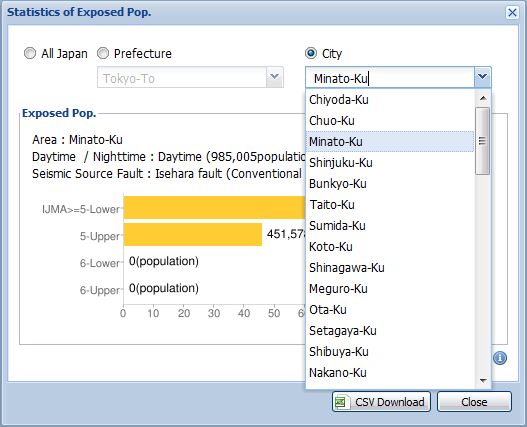
You can change a unit of statistics, Prefecture or City, by the radio buttons.
For example, to see the statistics of "Minato-ku, Tokyo", select "City" from the radio button and then "Tokyo-To"->"Minato-Ku" from the combobox.
Note that a administrative district where exposed population = 0 does not appears in the combobox.

Click the button "CSV Download" to download a CSV file of the statistics.
Encoding of the files is Shift_JIS. Description of the file format is available at the Download page.
 and the window which shows the summary of Exposed Population appears.