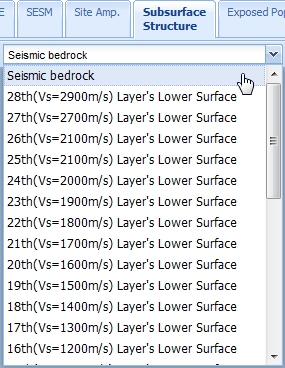
Maps of Deep Subsurface Structure are displayed by selecting the tab "Subsurface Structure".

Example of the map of Deep Subsurface Structure


You can select a type of map by radio buttons.
| Depth | : Depth of seismic bedrock or lower surface of a layer from ground surface |
| Elevation | : Elevation of seismic bedrock or lower surface of a layer |

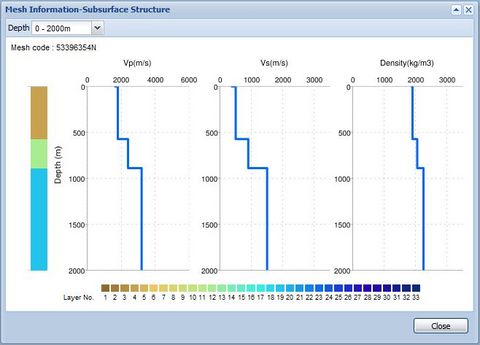
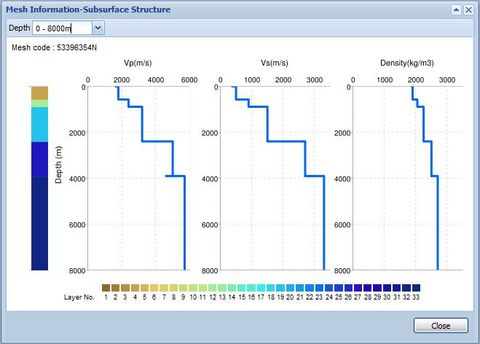
Zoom in the map to level of 11 or more and double-click the map. The Mesh Information window open, which shows detailed information about the mesh that you clicked and displayed as red rectangle on the map.

From left side, the graphs are arranged columnar section (see layer No. below), distribution of P-wave velocity, S-wave velocity, and density. You can change the range of depth by the "Depth" combobox.

 and the window which shows the summary of Deep Subsurface Structure map appears.